

Dr. Phil Cardoso
September, 2017
Nutrition and management of the dry dairy cow has been an area of extensive research over the last 25 years. Although nutritional requirements during this phase are fairly simple, the sudden transition from the non-lactating to the lactating state as well as the physiologic and metabolic processes associated with it make the transition period a fascinating and important stage of the production cycle of the dairy cow. Indeed, the transition period (3 weeks before calving through 3 weeks after calving) has been considered by some researchers as the most critical and stressful phase of the lactation cycle.
At the beginning of the transition period, cows may start to experience depression in
dry matter intake (DMI), which, along with the increased energy requirements for maintenance, the growing fetus, and the mammary gland in the last month of gestation can lead to negative energy balance (NEB). Consequently, body fat reserves start being mobilized prior to parturition to offset the deficit in glucose. Energy balance deficit and fat mobilization continue after parturition, as DMI in earlier lactation does not keep up with the increased requirements for lactation. Thus, the transition period is characterized by decreased DMI, body fat mobilization that results in higher circulating non-esterified fatty acids (NEFA), production of ketone bodies (mostly beta-hydroxybutyrate; BHB), and hepatic lipid accumulation, all of which may lead to suboptimal transitions.
Unsuccessful transitions are linked to metabolic problems that compromise production, reproduction, and health of the cow during early lactation, which in turn decrease the profitability of the dairy farm and increase the risk for culling of cows. Therefore, nutritional and management strategies that promote greater DMI and decrease fat mobilization are desirable during the transition period.
Cow comfort is a pivotal piece in the management strategy. For instance, researchers from the University of Wisconsin proposed that the barn to house cows during the transition period should be called the “Special Needs Barn.” Alluding to the special teams in the NFL that have the unique task of returning the ball, this barn design delivers specific free stall and head lock measures that allow for improved comfort and maximize DMI during the transition period.
All of the items mentioned above are important. I would dare to say that most dairy farmers in the U.S. know about them. So why haven’t we stopped talking about the transition period? Sometimes we can get nowhere if not focusing on the right things.
For example, having a Special Needs Barn or a specific diet does not guarantee that the transition period program will be successful. We must focus on things that reflect relevant aspects of the transition period.
Our objective in this article is to highlight practical outcomes to be measured that can help dairy farmers and consultants to keep track of the transition cow program. To do that, we have selected 10 indicators with our recommendations on where dairy farms should stand (Table 1). In a future issue we will talk about the next 5. Here are the first 5:
1. DMI
There is little evidence that milk yield per se contributes to greater disease occurrence. Our group and others have established that NEB is primarily a function of DMI and not milk production early postpartum. In that research, cows at 3 weeks after calving that produced 50 lbs of milk per day were at the same energy balance as cows that produced 90 lbs of milk per day. However, cows with greater DMI had improved energy balance (less NEB). Cows have a genetic drive to produce milk at all costs. Therefore, it is very important to measure DMI of cows during the transition period to prevent NEB and consequently metabolic disorders and reproductive failure. There are equations that can be used to predict the DMI that cows should be achieving. In Figure 1, we give an example for a cow with 1,500 lbs of body weight, producing 85 lbs of milk per day with milk fat at 3.5%.
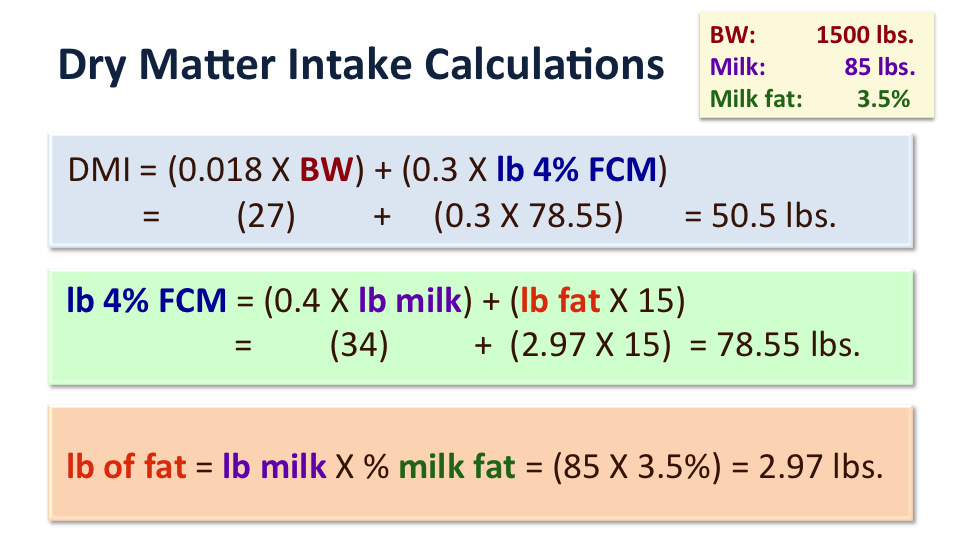
Figure 1. Dry matter intake prediction.
2. Body Condition Score (BCS)
Cows with excessive body lipid reserves (high BCS) mobilize more of those lipids around calving, have poorer appetites and DMI before and after calving, have impaired immune function, have increased indicators of inflammation in blood, and may be more subjected to oxidative stress. What constitutes “high” BCS relative to the cow’s biological target remains controversial. Recommendations for optimal BCS at calving have trended downward over the last two decades, and in our opinion a score of about 3.0 (1-5 scale) represents a good goal at present. Adjustment of average BCS should be a longstanding project and should not be undertaken during the dry period. Researchers from the University of Wisconsin showed that cows that either gained or maintained BCS from calving to 21 days after calving had higher (38.2 and 83.5%, respectively) pregnancy per AI at 40 days than cows that lost BCS (25.1%) during that same period. Other researchers have established that cows that lost >1 BCS unit (1-5 scale) had greater incidence of metritis, retained placenta, and metabolic disorders (displaced abomasum, milk fever, ketosis) as well as a longer interval to first breeding than cows that lost < 1 BCS unit during the transition period. Therefore we suggest that BCS change should be kept to a minimum.
3. BHB
Beta-hydroxybutyrate is a ketone body indicative of ketosis. It can be measured in the urine, blood, or milk of cows. Clinical ketosis is characterized by blood BHB concentrations ≥ 3.0 mmol/L (or 3000 μmol/L or 31 mg/dL) while subclinical ketosis is characterized by blood BHB concentrations greater than 1.2 mmol/L (or 1200 μmol/L or 12.4 mg/dL). Early occurrence of subclinical ketosis is more likely to decrease milk yield and compromise fertility. Researchers from the University of Wisconsin and Cornell University found that cows with subclinical ketosis detected between 3-7 days after calving were 0.7 times as likely to conceive to first service and 4.5 times more likely to be removed from the herd within the first 30 days in milk compared with cows that developed ketosis at 8 days or later. They have created a “herd alarm” and suggest taking steps to keep the proportion of the herd with blood BHB ≥ 1.2 mmol/L in the first week after calving to below 15%.
4. Urine pH
Milk fever (hypocalcemia) is an important problem that affects lactating dairy cows, particularly those starting their second or greater lactation. It is characterized by serum total calcium (Ca) < 5.5 mg/dL (or < 1.4 mM) around calving, as well as clinical signs (downer cow). A less recognized problem is the prevalence of subclinical hypocalcemia, which has no clinical signs and is typically characterized by serum total Ca < 8.5 mg/dL (or < 2.1 mM). Researchers from the Universities of Wisconsin and Florida have showed that cows with subclinical hypocalcemia have increased risk for metritis, increased risk for post-partum fever, increased post-fresh BHB (1.0 vs. 0.7 mmol/L), longer median days open (124 vs. 109 days), and immune suppression. The most effective prevention seems to still be through dietary means. Feeding a negative DCAD (dietary cation-anion difference) diet 21 days before calving has been shown to prevent clinical (a five-fold reduction) and subclinical hypocalcemia. The cow’s acid-base status is changed resulting in an increased amount of calcium available in the blood. Urine acidity is affected by these changes in the cow’s acid-base status as early as 2 days after starting the diet. Checking the urine pH of cows in the pre-fresh group can help you to monitor the effectiveness of an anionic ration.
5. Number of cows culled before 60 days in milk
This one is pretty straightforward. Transition problems significantly increase the risk that a cow will be culled, so keep track of where your herd is at. The goal should be to have < 5% of the milking herd leaving the dairy before 60 days in milk, and < 3% should die before 60 days in milk (8% total).
Table 1. Relevant steps to be measured in dairy herds and their level of adequacy for a successful transition period program.
| Step/Indicator | Great job! Keep it up |
Attention! Needs adjustment |
Stop! Needs improvement |
| DMI average 3 weeks before calving for mature cows, kg (lbs) | > 13 (28.5) | 10 to 13 (22 to 28.5) |
< 10 (22) |
| DMI average 3 weeks before calving for heifers, kg (lbs) | > 11 (24.2) | 8 to 11 (17.6 to 24.2) |
< 8 (17.6) |
| DMI average 3 weeks after calving for mature cows, kg (lbs) | > 17 (37.5) | 13 to 17 (28.6 to 37.5) |
< 13 (28.6) |
| DMI average 3 weeks after calving for 1st lactation cows, kg (lbs) | > 15 (33) | 11 to 15 (24 to 33) |
< 11 (24) |
| BCS change from dry-off to breeding (~ 60 days after calving), unit score (1 to 5) | < 0.75 | 0.75 to 1 | >1 |
| Proportion of cows with BHB ≥ 1.2 mmol/L during the first week after calving , % |
15 | 15 to 30 | > 30 |
| Urine pH before calving | 5.5 to 6.5 | 6.5 to 8 | > 8 |
| Proportion of cows culled before 60 days after calving, % | < 8 | 8 to 15 | > 15 |